# Date the work was done
August to October 2021
# Taking the policy team through the new template
Once we knew the new template was technically possible to produce, our content designer showed it to the policy team to make sure it was ok. They were happy with the layout and also gave us some insight into some of the information in the template.
This included:
the rationale needs to be written in a certain way and not copied and pasted from the school application form the question about what percentage of Good or Outstanding schools in the diocesan trust could possibly be removed
# Testing the new template with our users
Once we had sign off from the policy team, we wanted to test the new template with our users. We wanted to test it with all users of the document and not just delivery officers.
For the testing we:
- spoke to 4 delivery officers with different level of experience in1 to 1 sessions
- Created a click test through UserZoom where 12 Advisory Board members, 2 Advisory Board secretariats and 2 regional schools commissioners (RSCs) took part.
- Spoke to 3 RSCs and 1 Advisory Board member in 1 to 1 research sessions
# How we included people with access needs and lower digital confidence
When asking people to sign up for research, we asked on the consent form about if they had access needs (people who took part in the UserZoom click test were not asked this question). The majority of people said they did not have access needs but 2 people did describe having cognitive impairments. In our UserZoom click test, we asked people about how confident there were in using specialist software. 2 people described not being confident using specialist software. 2 people also said they are not confident in learning to use new software.
# Outcomes of the testing
Through analysing the research, we learnt a lot about the project template and what people expect to see. We also learnt about how RSCs and Advisory Board members consume the template.
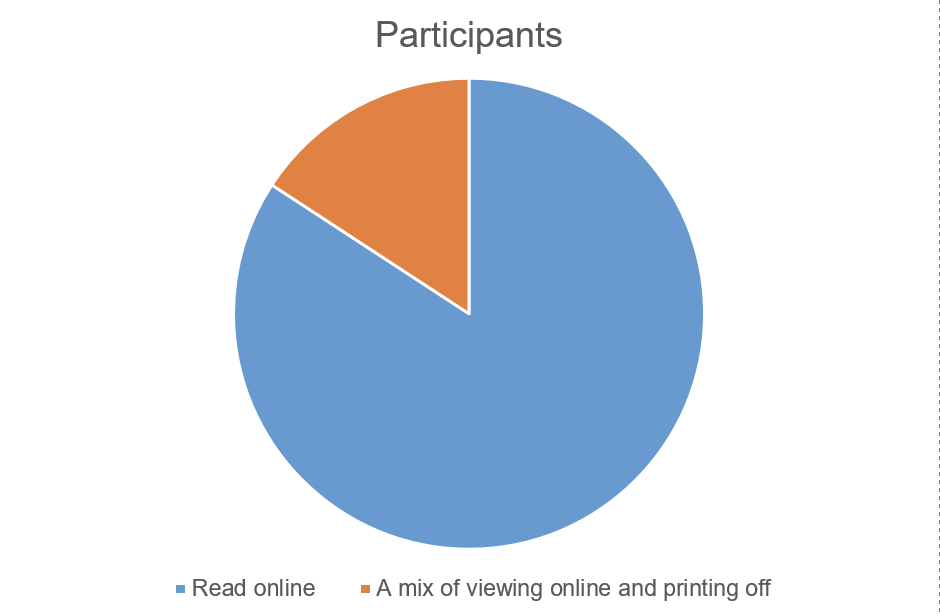
# How people read the template and how long they take
- Of the people who complete the UserZoom click test, 80% (16) read the template online.
- 1 person mentioned they use OneNote for their project template and don’t print them. 1 secretariat said regions use different formats like Word, PDF and OneNote
- RSCs can sometimes spend up to 15 to 30 minutes reading 1 project template. Overall, they could spend up to 5 or 6 hours reading 20 - project templates going to one Advisory Board meeting.
# Long and short-term recommendations
From analysing the research, we identified some areas where the team could improve the template in the short term. We also identified areas that need more research and work to do in the long term after our private beta.
# Grouping of information
The way information was grouped in the new template made sense to people so we will reorder our prototype and our build which will go into private beta soon to match this. In the long term, we believe we could do more research to better group information in the template overall. We discussed using something like card sorting with RSCs and Advisory Boards to see if we can structure all the information in the template better.
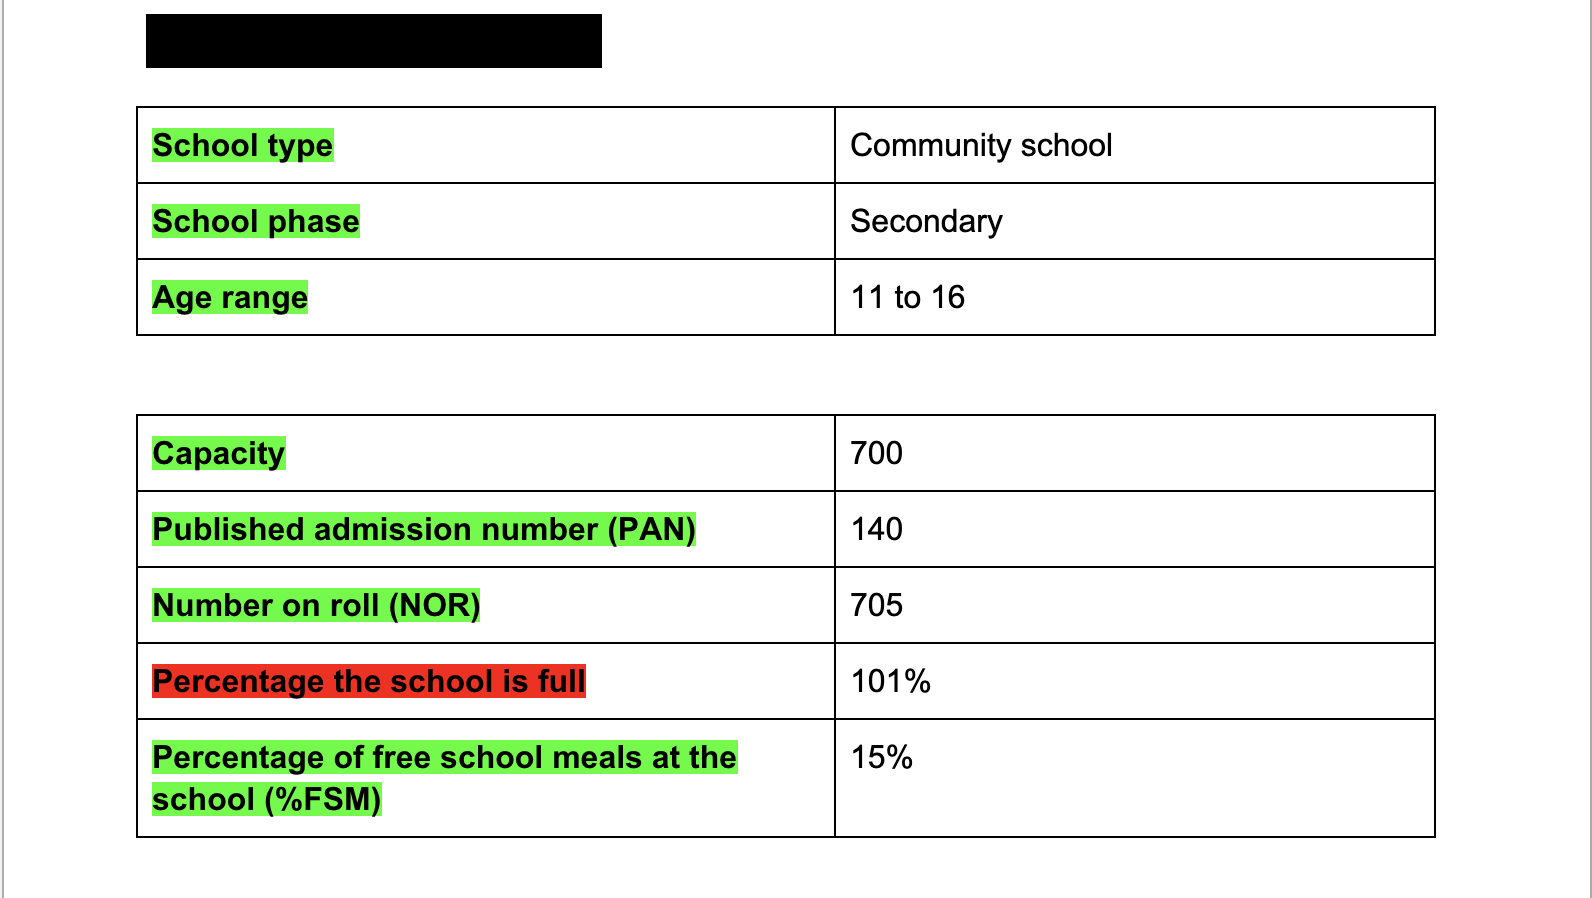
# School budget information
The current section could be more useful if we include:
- information on if the school has any loans or leases
- 3 years’ worth of financial data instead of 2
There were also discrepancies on if something called an ESFA template was needed or not. We need to do more research to understand this template.
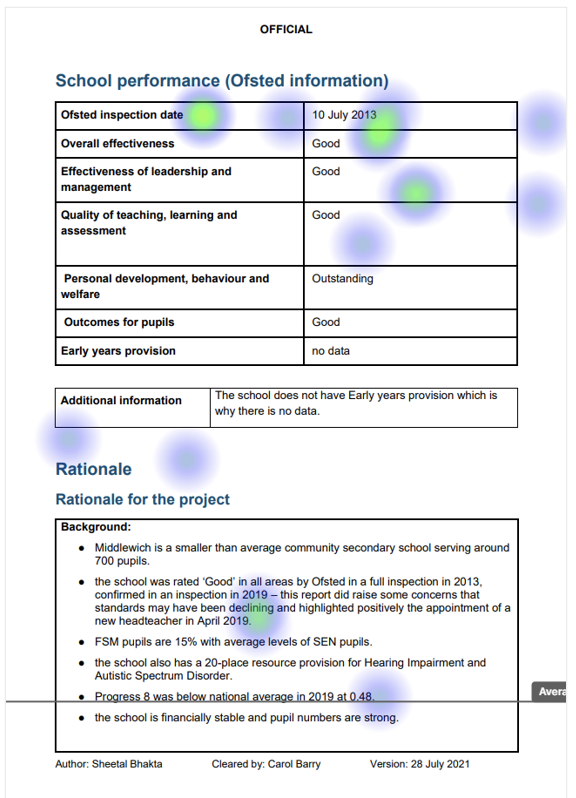
# Ofsted information
There were some discrepancies on what people wanted to see in this section:
- 2 people mentioned seeing if the latest Ofsted inspection was a full or short inspection
- 1 person said seeing the Ofsted grade earlier on in the template would be useful
- 1 person said the table should include ‘6th Form’ data if the school has one
However, most people agreed the table was too big and not economical. We need to look at this table again and see how we can better present the information that’s needed. There are also some technical constraints about pulling in this data that we need to work around.
# Breaking large text areas down
The sections called ‘Rationale’ and ‘Risks and issues’ are currently free text boxes.
- People found the sub-headings in the template we tested useful. They also felt the bullet points helped with reading the content.
- There were some discrepancies on what to include in the risks and issues section, like mentioning PFI or not.
We think in the long term we can break these text boxes down into more focussed questions to help delivery officers mention the right things.
# Key stage tables
There was consensus that the way we presented these tables were clearer than how they look in KIM (knowledge information management), the system delivery officers currently use to process conversions. However, our tables were too long and made it difficult for RSCs to compare data like Progress and Attainment 8. We also learnt some people want detailed information and some people do not.
Our recommendation is that we need to re-look at these tables so that we can understand what people need to see so we can present them in a better way.
# The future of the template
Overall people said the new layout was clear and easy to read but too long. From speaking to RSCs and Advisory Boards we want to look at the template as a whole and see if there are other ways or presenting the information. This is because Word has some technical and design constraints and we think we can better meet user needs with a more flexible, accessible solution.
To do this we’ll need to iterate what we can do now, and then take the learnings from this research and our private beta to investigate how we can help RSCs and Advisory Boards consume this information better.
# Screenshots